


Electrocardiographic Changes in Hypothermia
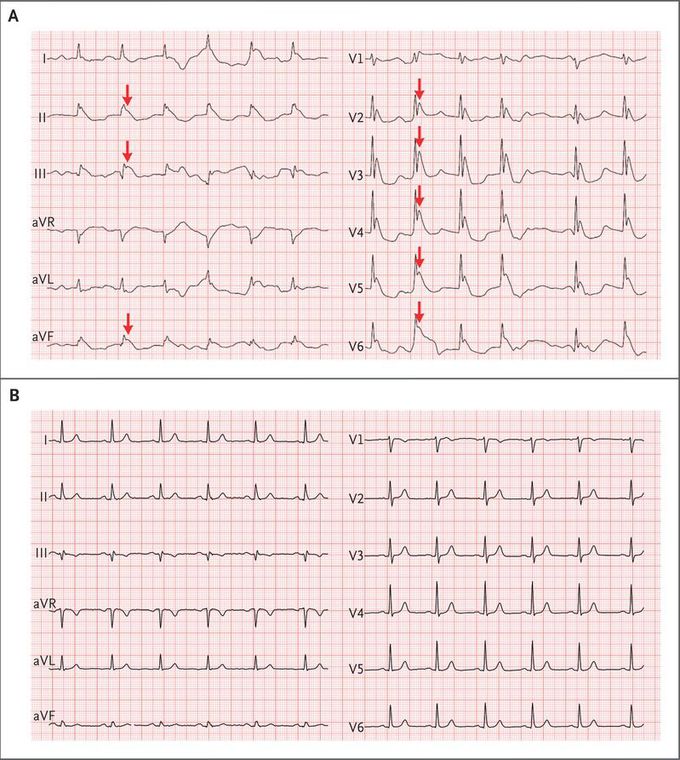
A 76-year-old woman with a history of dementia and coronary heart disease was brought to the emergency department after she had been found lying outdoors for an undetermined period; her core body temperature was 26°C (78.8°F) at presentation. An electrocardiogram showed prominent Osborn waves, also known as J waves (Panel A, arrows), along with prolonged QRS duration and corrected QT interval. Laboratory testing revealed a serum potassium level of 5.7 mmol per liter (reference range, 3.5 to 4.6), a creatine kinase level of 1230 U per liter (reference range, 25 to 190), and a serum pH of 7.19. The serum calcium level was normal. Hypothermia induces an increase in the activity of the cardiac transient outward potassium current, which is more prominent in the epicardium than in the endocardium. This heterogeneous distribution of potassium current results in J waves that are typically observed in the inferior and lateral precordial leads, as seen in this patient. The magnitude of the J waves may generally be associated with the degree of hypothermia. In addition to hypothermia, J waves have been associated with conditions that can occur in normothermia (e.g., hypercalcemia, the Brugada syndrome, and neurologic injury). After the patient was rewarmed for 12 hours, the J waves disappeared, and the QT interval and QRS duration normalized (Panel B).