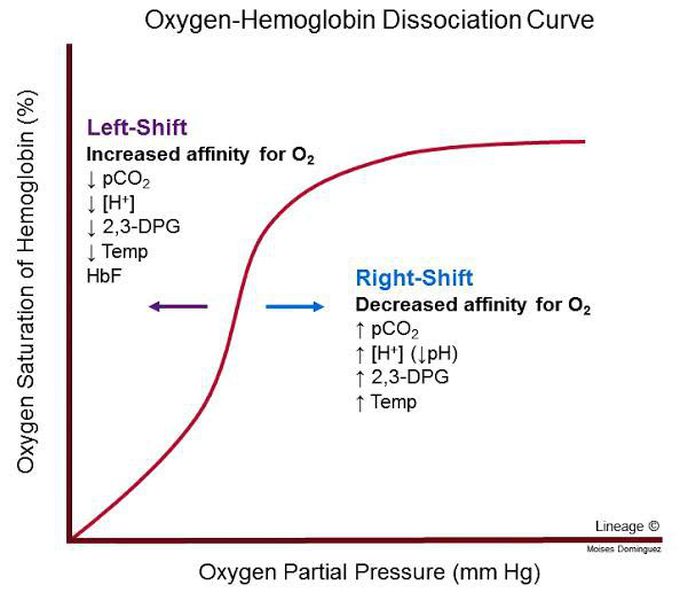


Oxygen-Hemoglobin-dissociation curve
Oxygen-Hb-dissociation curve shows partial pressure of oxygen (mm Hg) on x-axis and Hb% saturation with O2 on y axis. The shape of the curve is 'sigmoidal' due to cooperative binding of oxygen. This allows the incoming oxygen molecules to bind more easily than the previous ones. The provided picture gives an account of all the factors which shift the oxygen-dissociation curve. A shift towards right indicates decreased oxygen affinity of hemoglobin and stability of the T (taut/deoxy) form of Hb, both of which lead to better unloading of O2 in peripheral tissues. A shift towards left indicates increased oxygen affinity of Hb and stability of R(relaxed/oxy) form of Hb. This helps in loading of oxygen in the lungs. Image via: https://images.app.goo.gl/ZvM6G6esgb2xfGhg6

