


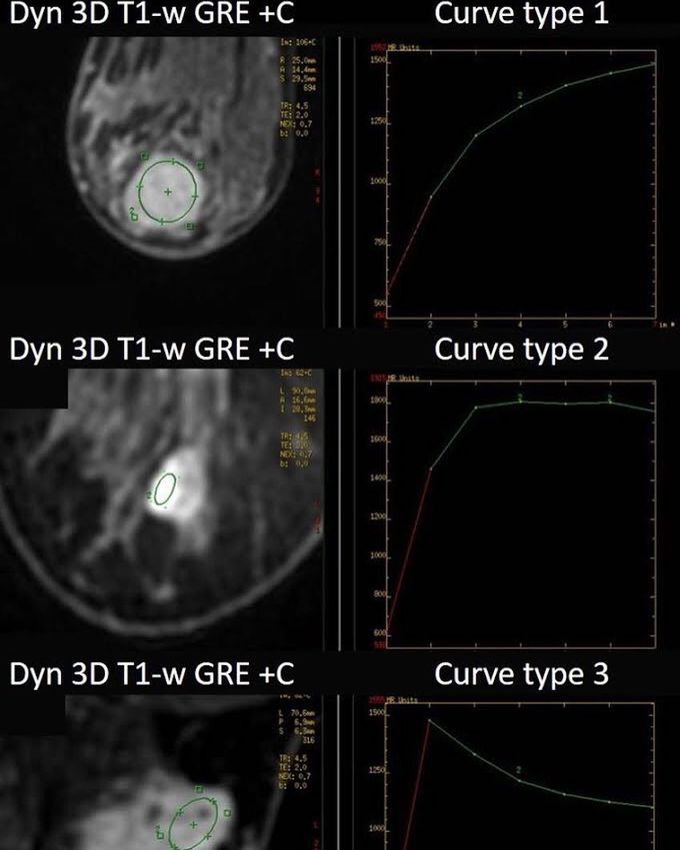
Three possible enhancement kinetic curves in breast MR Imaging
Figure illustrates the three possible enhancement kinetic curves in breast MR Imaging (can also applied to other organs such as prostate), after the administration of Gadolinium-based contrast agent (GBCA). a) Curve type 1: progressive enhancement pattern • Typically shows a continuous increase in signal intensity throughout time. • Usually considered benign with only a small proportion of (5-10%) of malignant lesions having this pattern. b) Curve type 2: plateau pattern • Initial uptake (slow or fast) followed by plateau phase towards the delayed phases of the dynamic study. • Suspected for malignancy. c) Curve type 3: washout pattern • Has a relatively fast uptake (wash-in) and shows reduction in enhancement (wash-out) towards the delayed phases of the dynamic study. • Considered strongly suggestive of malignancy. Images courtesy of Christos Tsiotsios.