


MRI Technologistabout 9 years ago
MRI is very useful at the follow-up step, in patients with established MS
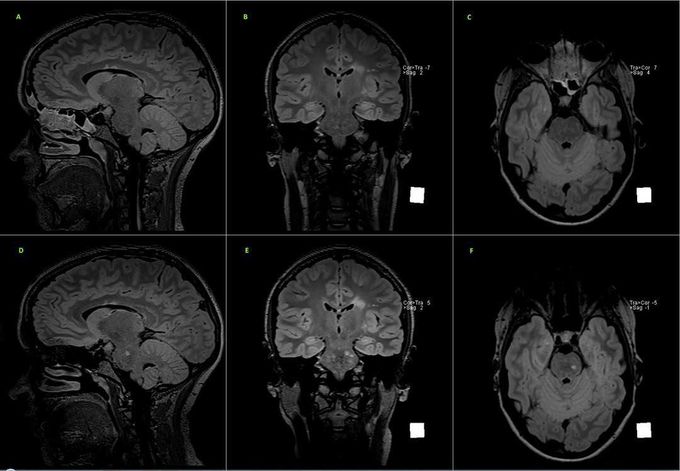
Upper row shows 3D FLAIR in sagittal (A), coronal (B) and axial (C) plane. Lower row shows 3D FLAIR in sagittal (D), coronal (E) and axial (F) plane. Lower row MR images (D, E, F) have been obtained six (6) months later compared to upper row's. Disease progression can clearly be seen in the form of new lesions in pons. Images courtesy of Bac Nguyen.
Other commentsSign in to post comments. You don't have an account? Sign up now!