

MRI Technologistalmost 9 years ago
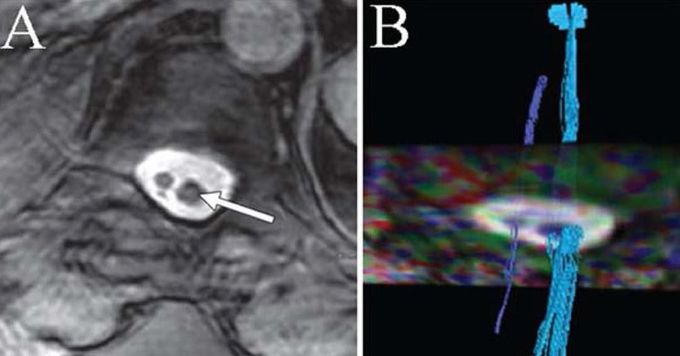
Tractography for spinal dysraphism
Tractography for spinal dysraphism exemplified in a 53-year-old women with diastematomyelia. Panel A shows two hemicords on an axial T2-weighted image at L3 level, with the larger cord on left (arrow). Panel B shows tractography of the two hemicords. The axial image represents color-coded FA map. Larger tract (light blue) is composed of greater number of individual fiber tracts and corresponds to larger (left) hemicord. (Filippi et al., Eur Radiol, 2010)
Other commentsSign in to post comments. You don't have an account? Sign up now!