
MRI Technologistalmost 9 years ago

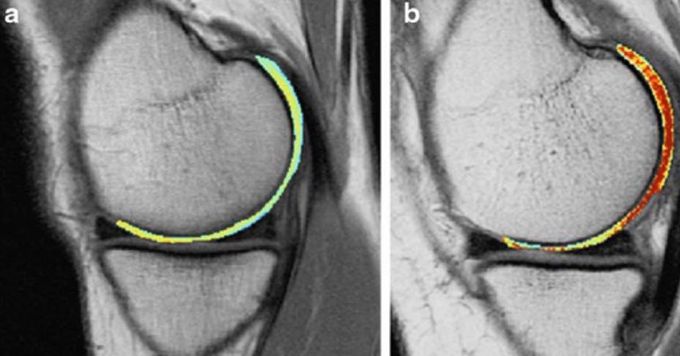
T2 mapping is more sensitive to cartilage hydration and orientation and integrity of the collagen network. In this example, T2 relaxation time maps overlaid on sagittal FSE images of the medial knee compartment. Low T2 values in (a) indicating low water content and suggesting integrity of collagen fibrils, while high T2 values in (b) indicate higher water content with cartilage degeneration, though cartilage volume appears to be maintained. Red color corresponds to high T2 value, while blue corresponds to low T2 value.
Other commentsSign in to post comments. You don't have an account? Sign up now!

